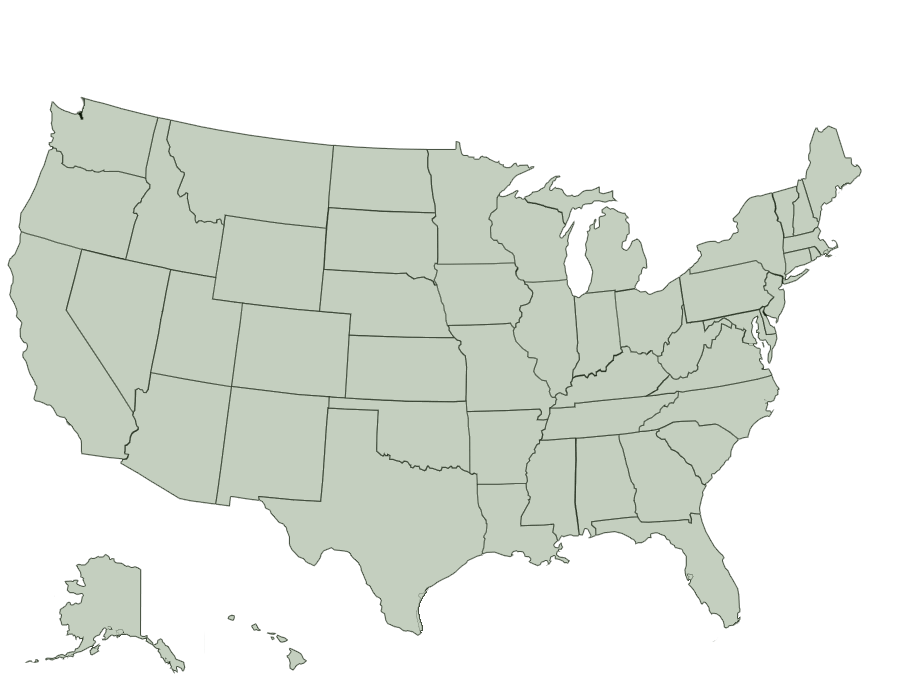
W&F’s renewable energy practice covers the entire United States. We regularly assist our lending clients in understanding the programs and practices in new and emerging renewable energy markets. The map below reflects those states in which our team has closed, worked on or is currently working on a renewable energy transaction. The data set forth in the boxes below the map is current through December 31, 2019 and reflects estimated figures for those transactions that achieved financial close. Total annual volume of RNG (renewable natural gas) produced from biomass facilities not included in the boxes below.

0
Renewable Energy Projects Closed
0
Electricity Added to the Grid in MW (DC)
$0
Aggregate Renewable Energy Loan Volume

